Cross-marker context
Markers are read together to identify friction patterns that may be invisible when values are reviewed one by one.
The technology is not just report extraction. The core value is how biomarkers are structured, normalized, calibrated by pathway, and mapped as interacting biological signals.
This page is for the analytically curious — buyers, corporate evaluators, or anyone asking “how do I know Sentinel reads data differently?” If you have not read How It Works yet, start there first. Full methodology: Platform Methodology.
Report structuring
Uploaded reports are converted into structured biomarker records with values, units, dates, and reference intervals.
Biomarker normalization
Messy lab formats are standardized so markers can be compared, scored, and tracked consistently.
Pathway calibration
The same marker can carry different weight depending on performance, recovery, body composition, or longevity goals.
Dashboard delivery
Results are organized into scores, friction zones, missing signals, and priority systems for follow-up tracking.
Standard lab tests use binary ranges — a value is either normal or abnormal. Sentinel maps each biomarker across five calibration zones: warning, friction, stable, optimised, and drift.
This is why Sentinel surfaces patterns that a pass/fail reference range misses — not because the marker is abnormal, but because it sits in a zone that carries friction under your specific goal.
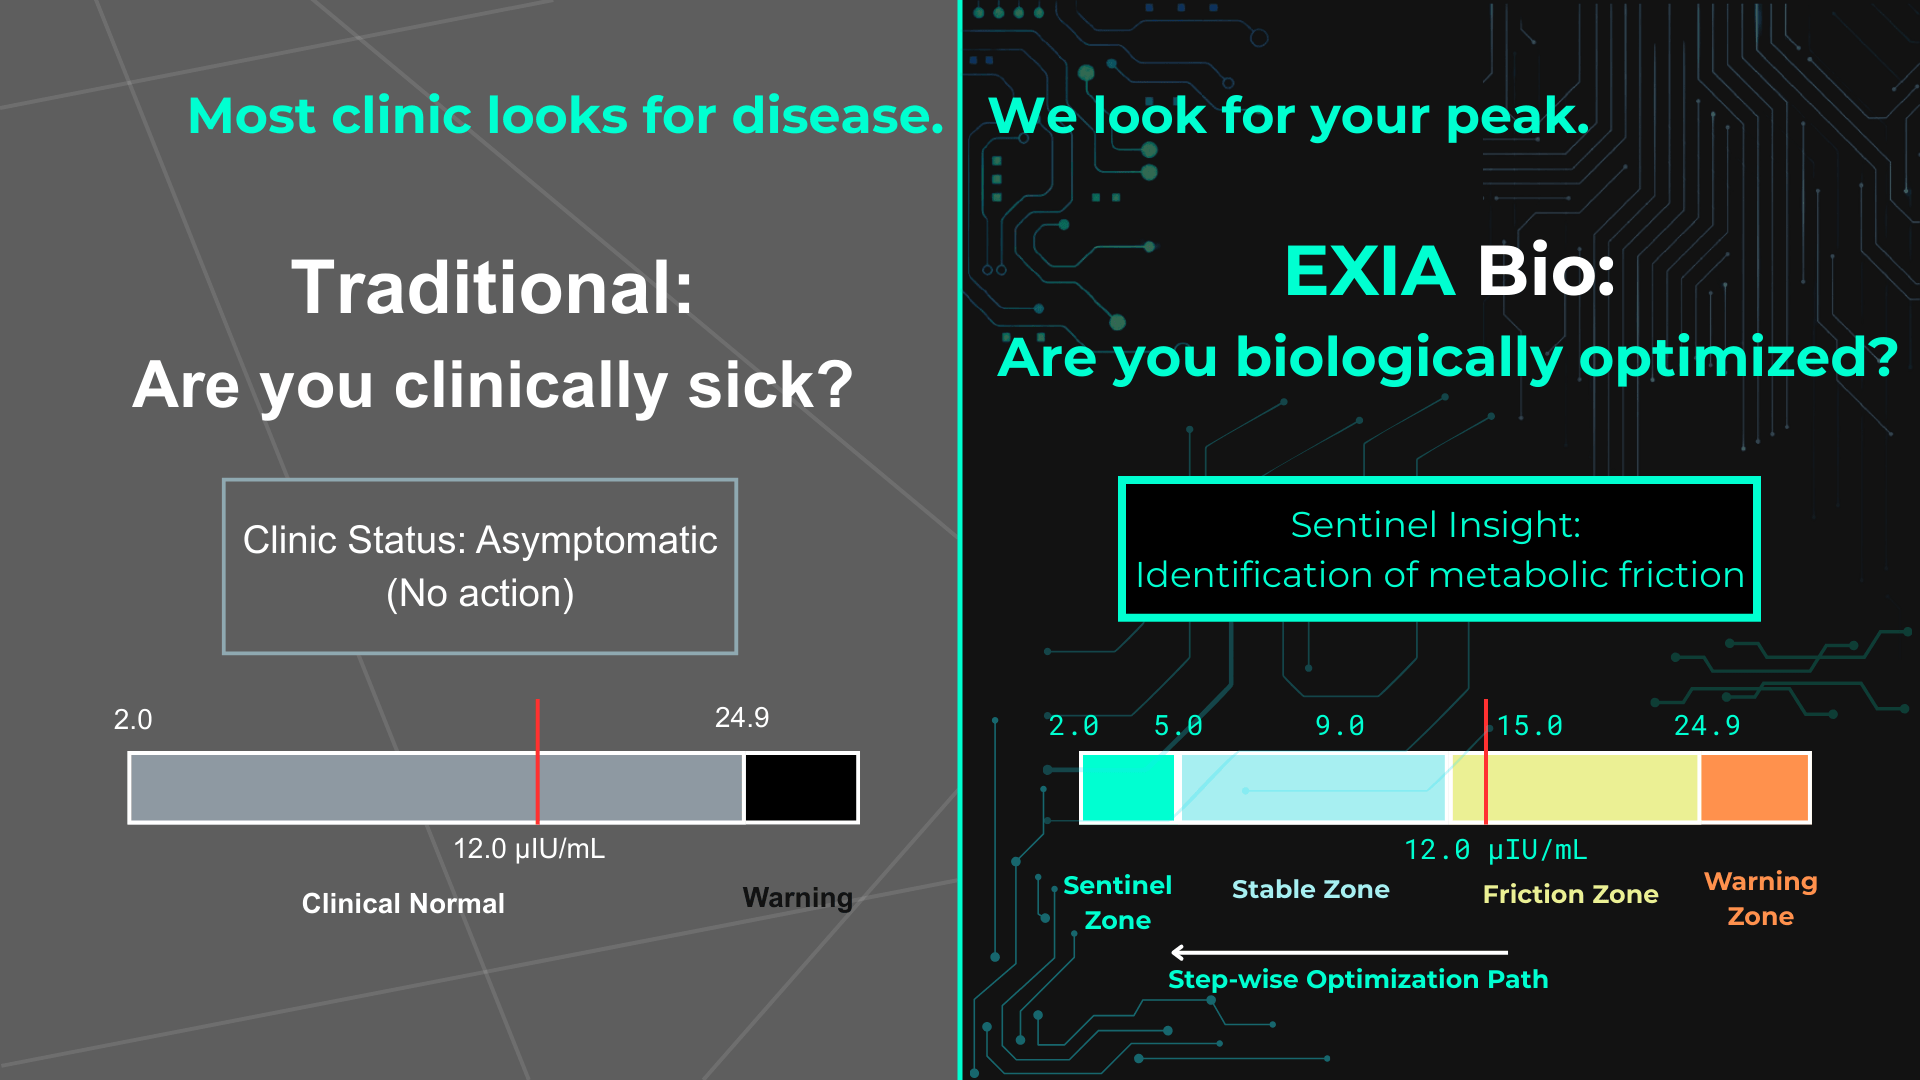
Sentinel calibration · The same marker value can be stable in one pathway and friction-loaded in another — depending on your goal.
A standard lab report tells you whether individual values fall inside broad reference ranges. Exia Bio maps how multiple values interact across metabolic, vascular, hormonal, recovery, inflammatory, and nutrient systems.
Markers are read together to identify friction patterns that may be invisible when values are reviewed one by one.
Values can be stable, drifting, friction-loaded, or outside expected reference boundaries — rather than simply normal or abnormal.
When a report lacks useful markers, the system shows which interpretation areas have lower confidence.
Future uploads can be compared against earlier baselines to identify improvement, drift, or unresolved constraints.
Exia Bio uses AI-assisted report structuring and quality workflow support. The visible customer value is the biological calibration layer: how the system transforms raw report data into pathway-specific dashboard intelligence.
01
Extract
Report values and units
02
Normalize
Clean biomarker records
03
Calibrate
Pathway-specific scoring
04
Deliver
Dashboard output
Exia Bio is designed around secure access, structured data handling, dashboard delivery, and operational quality control. Selected Azure services may support document intelligence, structured analytics, identity, monitoring, and platform reliability as the system scales.
Uploaded reports and intake responses are handled as sensitive biomarker data, not casual wellness content.
Biomarkers are stored and interpreted as structured records so future uploads can support continuity and trend tracking.
Launch-stage delivery preserves quality checks before dashboard release while automation is expanded progressively.
Understanding Exia Bio — three levels of depth
The Engine
Technology
You are here
Need the full technical methodology?
The Platform Methodology covers the product thesis, system workflow, and non-diagnostic boundaries for partners and institutional review.